 While the UK’s Automatic Vending Association may not have met its own objective of publishing this census, covering the year 2007, within six months of the data (i.e. by the end of June 2008) – it did succeed in publishing at the end of October, which is a significant improvement on last time which, itself, was a major advance on the year before.
Having an understanding of the amount of time and work that goes into compiling and producing this annual document, VI offers its sincere congratulations to David Hoskin and his team on presenting what is still the only credible set of statistics on the UK vending industry.
Introducing the AVA‘s 2008 Census, David said: “Many companies write their plans for the coming year in the third quarter – which makes June still our objective in publishing our annual census.
We hope companies reading this census who provide the data to Vizards, which we use for compilation purposes, will continue to do so in timely fashion. Without this co-operation we fail! In fact, we always hope to receive this data earlier than in the previous year. So please, as early as possible in 2009, sit down and fill in the census forms with your 2008 data, so we can become ever more efficient and effective in the timing of this publication.”
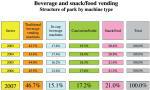
The base this year at 512,053 is just above the level it was at in 2003 (510,911).
This is not the sign of a healthily growing market, and indeed three of the four sectors shown here are declining.
Snackfoods have been under pressure from government agencies for some time in schools, and a 1.6 per cent decline in this base may be no surprise. Since the can sector is selling bottled product through glass fronted merchandisers (GFMs) the fact that there seems to be only a 1.4 per cent decline in the GFM base may not reflect snackfood resilience. However, there is evidence of an increase in cash per week per snack machine for all operators, and the ratios are only marginally off last year.
In-cup reflects the ‘big two’ bases more than operators, where some healthy in-cup activity is beginning to show. The slow decline in the base should bottom out over time, but it would seem the early strong growth phase is over.
The can base continues to decline, but this is mostly due to the marketing stances of the ‘big two’, where the switch of emphasis to the larger sized bottle is allied to vending through glass fronts. Thus, the issue in this sector is whether the bottle machines grow fast enough to compensate for the decline in the can machine base. So far the answer to this is ‘no’. This is a response in terms of machines, not volume of product sold, which may well be another story.
Traditional beverage machines as a sector contains the one truly dynamic segment of the market. While floor-standing machines mark time, table-top units accelerate through their hot, freshbrew machines. Thus the growth of two per cent overall is actually masking nearly 10 per cent growth in this one table-top sector.
Traditional machines and the operator
As in previous years the machine base was divided into:
- Instant versus freshbrew
- Hot versus hot & cold
- Floor standing versus table-top
- Operated versus self-operated (DIY)
The floor-standing machines for 2005, 2006 and 2007 – both freshbrew and instant, operated and DIY- have shown virtually no movement. Whereas the hot/hot&cold shows slight variation in favour of hot, the total floor-standing base remains static.
It is table-top which produces the growth, despite the fact that instant machines are trending downwards (this year at 36,954 versus 40,188 last year). Freshbrew at 86,698 machines is 9.9 per cent up (or 7,798 machines) making table-top overall up by 3.8 per cent (or 4,564 machines), even though instant machines suffered a base loss of 3,234 machines.
Largely due to this dynamic segment, the overall traditional beverage machine base is trending towards freshbrew (68 per cent this year versus 65.7 per cent last year) and hot (74.8 per cent over 73.6 per cent), while operated machines are growing (42.6 per cent over 41.7 per cent last time).
Product mix in is much the same as last year, and October/November cup and cash sales both show improvements on last year.
Free-on-loan equipment is down, while placement of new equipment seems stronger than last year for both operators and direct sellers.
Part-time employment has increased, and the machines per route are at their highest for five years.
Pricing in the workplace continues to rise, and 83 per cent of operators now invoice clients at over 10p for coffee.
In-Cup
There is a decline in the machine base from 80,021 to 77,274. Over the past five years the move down from 90,090 machines is 14.2 per cent (or 12,816 units).While floor-standing machines are down by nine per cent in five years at 45,244 from 49,677, the table-top category is in even steeper decline. Here the base is over 20 per cent down to 32,030 versus 40,413.
This might well reflect growing popularity with the use of operators, and the ending of the significant expansion phase for in-cup, driven by aggressive direct selling of table-top machines to smaller workplace sites by major players. Since these machines proved extremely long-lived, and the base control processes did not always accurately count machine losses, it has taken some time to adjust base sizes in the marketplace.
Furthermore, with new systems launched using pods/sachets, both major players are involved in the dynamic expansion of the table-top. fresh- brew sector, highlighted elsewhere in the census. It could be that r&d innovations will concentrate in this area rather than in-cup. Nevertheless, reports from the operator sector indicate profitable growth in several areas, which may be the next phase for in-cup.
With 59 per cent of sites at less than 25 people, it is not surprising that 60 per cent of the drinks sold by site are less than 500 per month. In-cup beverages sold per week, per machine for 2007 stood at 213.5 – up on the previous year. The operator is also ahead of last year, this time at 301 versus 292, which is noteworthy after a trend downwards for some years.
The direct sales sector at 80.2 is lower than last year, but here it seems likely that the volume growth of machine base reflects installations into smaller audience sized sites, as the more obvious sites are already penetrated. The fact that in 2003 consumption was 17 per cent higher than this year’s 80.2 drinks per machine per week seems to support this observation.
There is evidence of a profile where there is an even spread of machine age for the first five years of life, and then nearly half the base at six years and older. The long- lived in-cup table-top has been mentioned above. With so many machines in this part of the age profile, losses tend to mount, and new inputs to the base fail to cover the loss. Hence base decline.
Can and carton
2007 did not enjoy a good summer. It is therefore no surprise to see can sales through vending machines were down to 89.6 per week, a fall of just under five per cent. This market sector is, of course, dominated by the two big brands, but the other operators have declared improving sales. Results show an increase from 137 cans per machine, per week to 155.
There is a difference between national and regional operators. For example, nationals at 170 cans per machine per week, down on last year, in line with the total market. This contrasts with regional operators which, while gaining fewer sales than the nationals per machine, nevertheless improved sufficiently to push the overall average to 155.
An October/November 2007 ‘snapshot’ for all operators outside of the big two, shows can sales down to 160.8 per machine per week from 181.2. These had a cash value of £80.12, which was again down on the last year’s value of £83.39. This works out at just under 50p per can.
Machines in this sector straddle the divide between workplace and consumers on the move. Up to a quarter of machines with national operators, but only 10 per cent with regional operators, are outside the workplace. The two major brands are much higher than a quarter.
The overall base for this sector this year is 87,964 machines. These, of course, are can, carton and bottle machines. The figure is down by 3.2 per cent on last year, or just under 3,000 machines.
This only tells half the story. The can machine base was declared last year at 62,580, down 8.9 per cent on the 68,714 in the previous year. This year there is even more deterioration in this base, by a further 8.2 per cent to 57,464 machines. This means the carton and bottle base is now to 30,500 machines versus 28,250 last year. With cartons not growing significantly, the bottle base has expanded to 24,500 machines.
Food and snacks
With refrigerated food machines growing only gently over the years at around 20,000 machines in the base, the dynamism in this sector is provided by the glass-fronted merchandiser (GFM).
This year the GFM base is down by 1.4 per cent at 77,939 machines. This decline does not appear to be too dramatic considering the publicity involving schools in recent times. There are, in fact, some operators showing significant base increases.
Although national operator cash takings are down five per cent at £83.88, regional operators have increased cash takings per machine per week by 7.6 per cent to £68.58. When discussing the GFM segment of the market, there is, of course, a crossover to selling bottles which must be taken into account. Operators may well be selling drinks rather than snacks through their GFMs, and the economics could support any decisions they make to do so – the growth of the bottle machine base being highlighted elsewhere in the census.
There are signs of consumption patterns reflected by product mix moving back in 2007 to those shown for 2005, with 2006 looking isolated. This volatility may reflect operators adopting a more dynamic approach to snack retailing by changing product lines offered for sale in machines on a regular basis to maximize sales.
Free-on-loan placement of machines still shows over half of all machines in this category. While at 51.6 per cent, this is down on last year’s 57.5 per cent and there remains a significant difference between national and regional operators.
Payment Systems
In fact, there is little variation from the total market of the previous year. Free-vend generally is a small amount lower. Direct selling is still half free-vend, albeit down 4.2 per cent on last time. This sector pulls the industry average up, while can and snackfood sectors pull in the opposite direction, with almost no free-vend. National and regional operators are a little down on last year – either way, no particular trend is apparent. It seems the client for this type of service basically chooses to provide free drinks for about a quarter of its employees.
This contrasts with the predominantly DIY client, which buys from direct sellers and opts for twice as much free-vend. It could be related to the client’s attitude to cash handling, though this does not seem to influence clients to go cashless!
All operators are shown to have 23.5 per cent free-vend. Cashless remains little used in operator bases (between 2.5 per cent and 6 per cent), but is far more popular in other parts of the base, best of all with the contact caterer. This probably reflects the profile of clients in the base.
Nevertheless, cashless at 7.1 per cent this year is down on last year’s 7.7 per cent and does not appear to be likely to break through the 10 per cent barrier.